

What is Digital Experience Monitoring (DEM)?
Digital Experience Monitoring (DEM) refers to the practice of tracking and analyzing the performance and quality of digital interactions users have with an application or service. DEM goes beyond traditional system metrics to focus on the perspective of end users, combining real-time monitoring with contextual data about how users navigate digital platforms. It covers web, mobile, and cloud-based applications, and ensures that companies can measure, manage, and improve the user experience to maintain a competitive edge in the market.
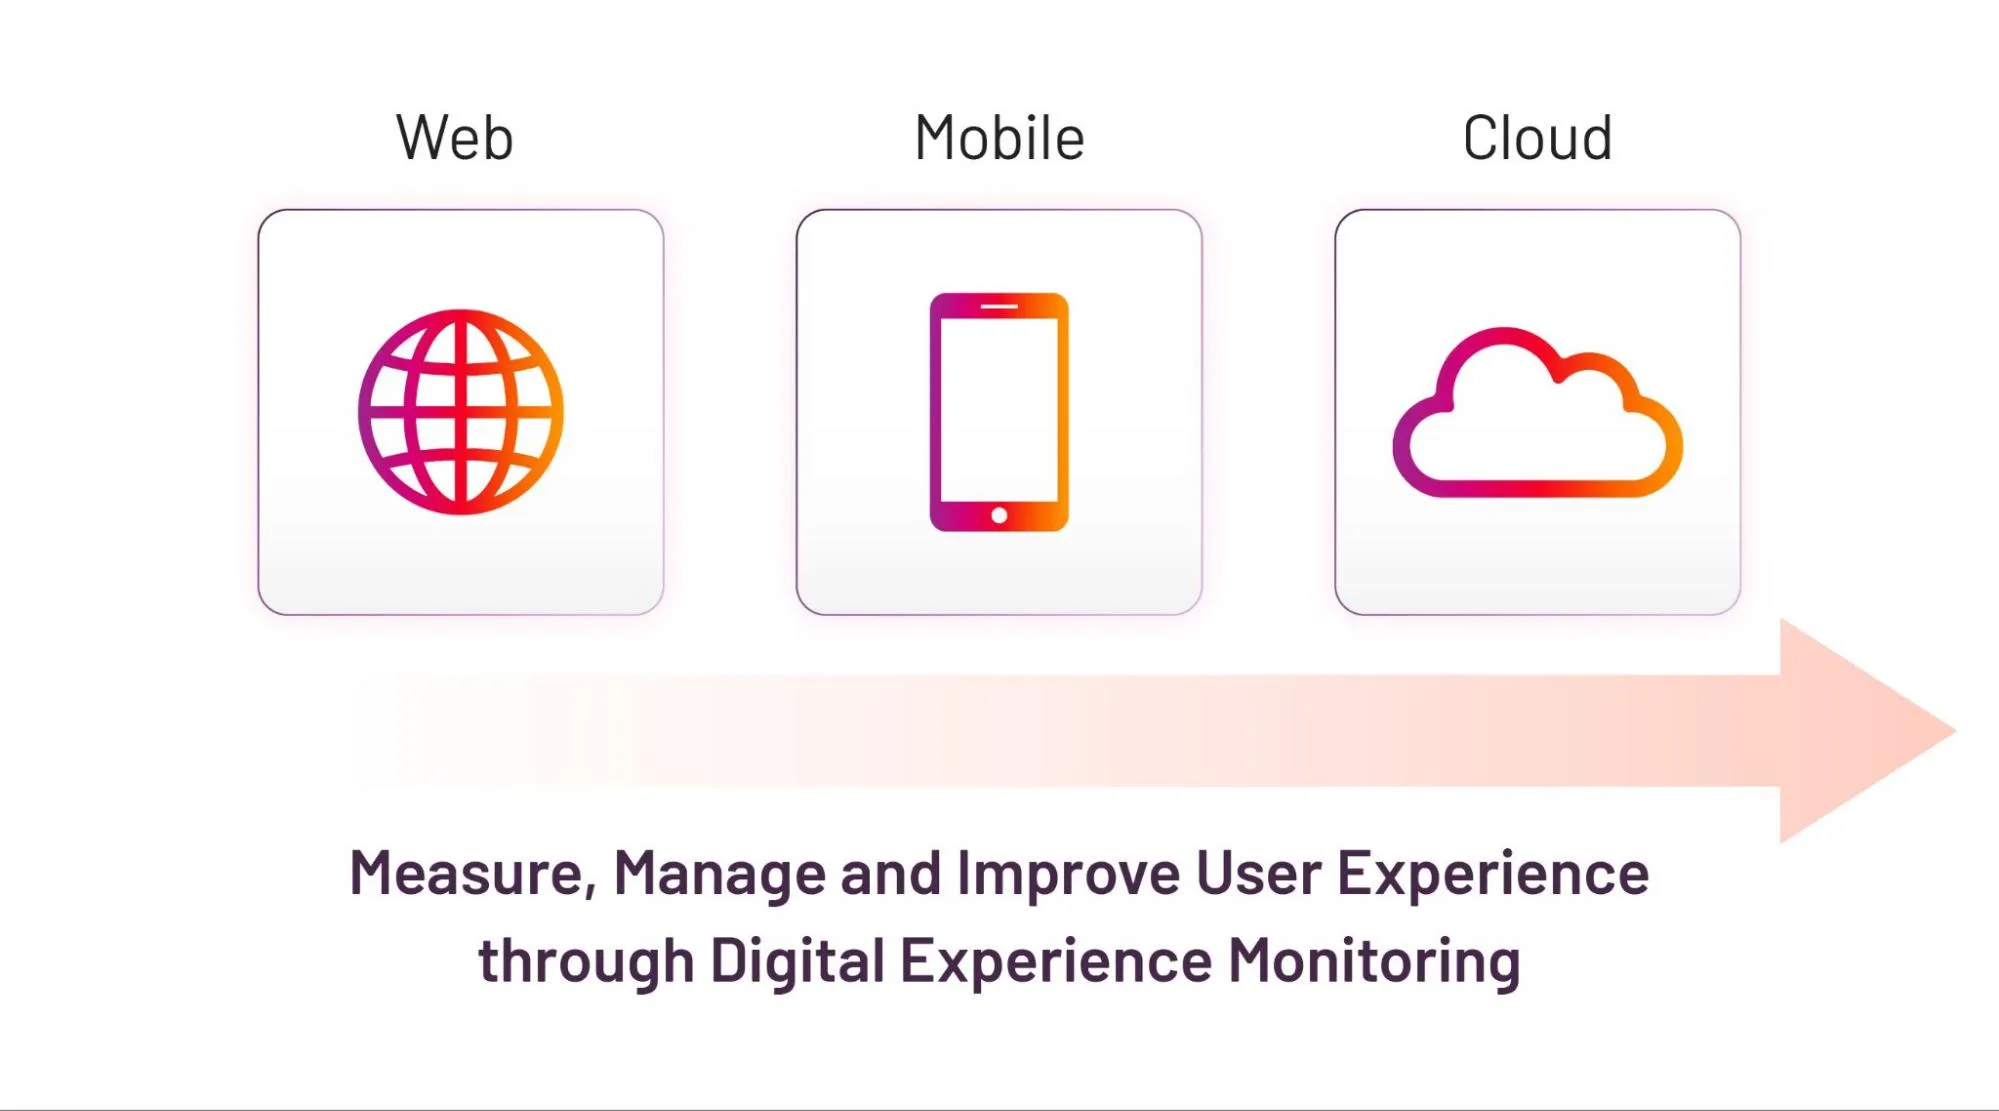
Fig 1: Coverage of Digital Experience Monitoring (DEM)
Why Is Digital Experience Monitoring (DEM) Critical For Business?
DEM is crucial for ensuring that customers have a seamless and engaging experience. By leveraging DEM in conjunction with business journey observability, companies can proactively identify and address issues impacting user satisfaction and business success, such as slow loading times, broken links, or poor responsiveness, to optimize customer journeys and operations, and stay ahead of competition.
Key Elements of DEM
1. Real User Monitoring (RUM): Monitoring real-world usage by capturing performance data as users interact with the application. RUM provides end-to-end visibility into the real-time activity and experience of individual users.
2. Synthetic Monitoring: Simulating user interactions to continuously test and monitor the performance and availability of applications.
3. Network Performance Monitoring (NPM): Monitoring network components that affect digital services, including latency, packet loss, and throughput.
4. Application Performance Monitoring (APM): Tracking the performance of code, databases, microservices, etc., to ensure back-end systems are working optimally.
DEM Architecture
The architecture of DEM typically comprises three layers:
1. Data Ingestion Layer: Various sources such as devices, web pages, network sniffers, simulated interactions, and APIs contribute data.
2. Nonrelational Database Management System (DBMS): This layer stores the collected data, facilitating analysis and modeling.
3. AI/ML Layer: Predictive analysis, trend analysis, pattern matching, and data visualizations aid in uncovering issues and informing business decisions.
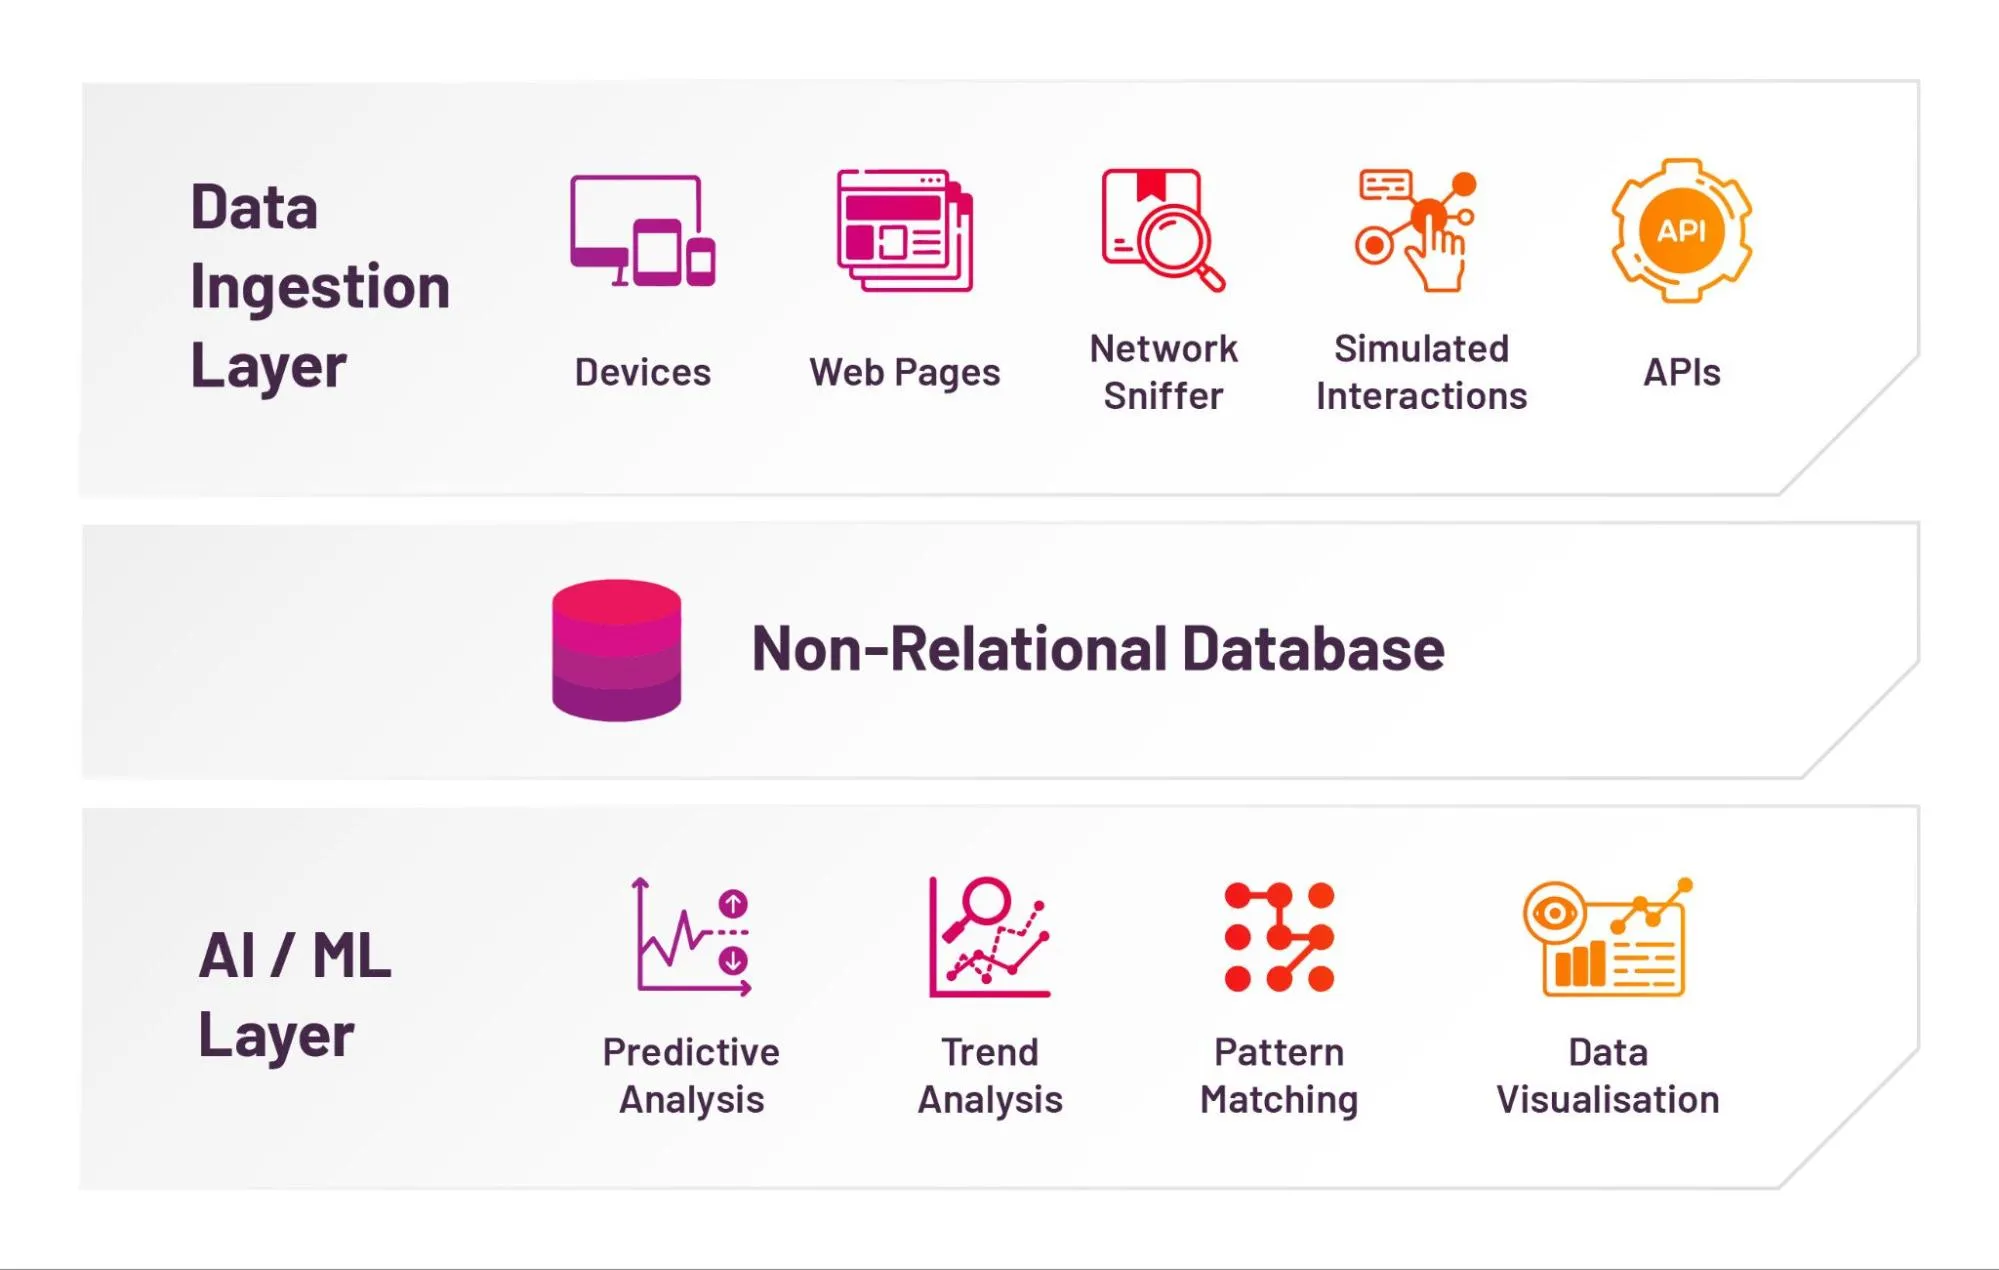
Fig 2: Architecture of Digital Experience Monitoring (DEM)
What Are The Benefits of Digital Experience Monitoring?
DEM provides valuable insights for data-driven decision-making, aligning digital efforts with business goals, and driving customer satisfaction, engagement, and revenue growth. DEM in observability software also offers a range of advantages:
1. Proactive Issue Identification: Early detection and resolution of disruptions across digital touchpoints.
2. Enhanced User Experience: Optimizing interactions through performance metrics like response times and load speeds.
3. Efficient Troubleshooting: Deep visibility into underlying causes for faster resolution.
4. Data-Driven Decision Making: Insights to guide infrastructure optimization, capacity planning, and application improvements.
Challenges With Digital Experience Monitoring
This section highlights common challenges in DEM given modern distributed environments and data growth.
1. Complex, Distributed Architectures
Modern microservices-based applications rely on multiple third-party services and hybrid cloud setups, making end-to-end correlation difficult.
2. User Context Variability
Different devices, networks, and regions create inconsistent user experiences, making root-cause identification harder.
3. Lack of Business Context
Traditional monitoring misses business impact such as revenue loss from performance issues. Advanced observability tools like ContextStreams solve this.
4. Alert Fatigue and Noise
Too many low-priority alerts hide critical issues. Sarika Atri discusses “silent failures” in Observability Talk: Click here to watch
5. Siloed Monitoring Tools
Different teams use isolated tools, preventing unified visibility and correlation.
Addressing DEM Challenges via Business-Centric and Journey-Centric Observability Software
1. Business-Centric Observability
Business-centric observability aligns system metrics with business KPIs like revenue, conversion, and satisfaction.
A retail example: If page load time exceeds 3 seconds, cart abandonment rises. BCO + DEM helps correlate this.
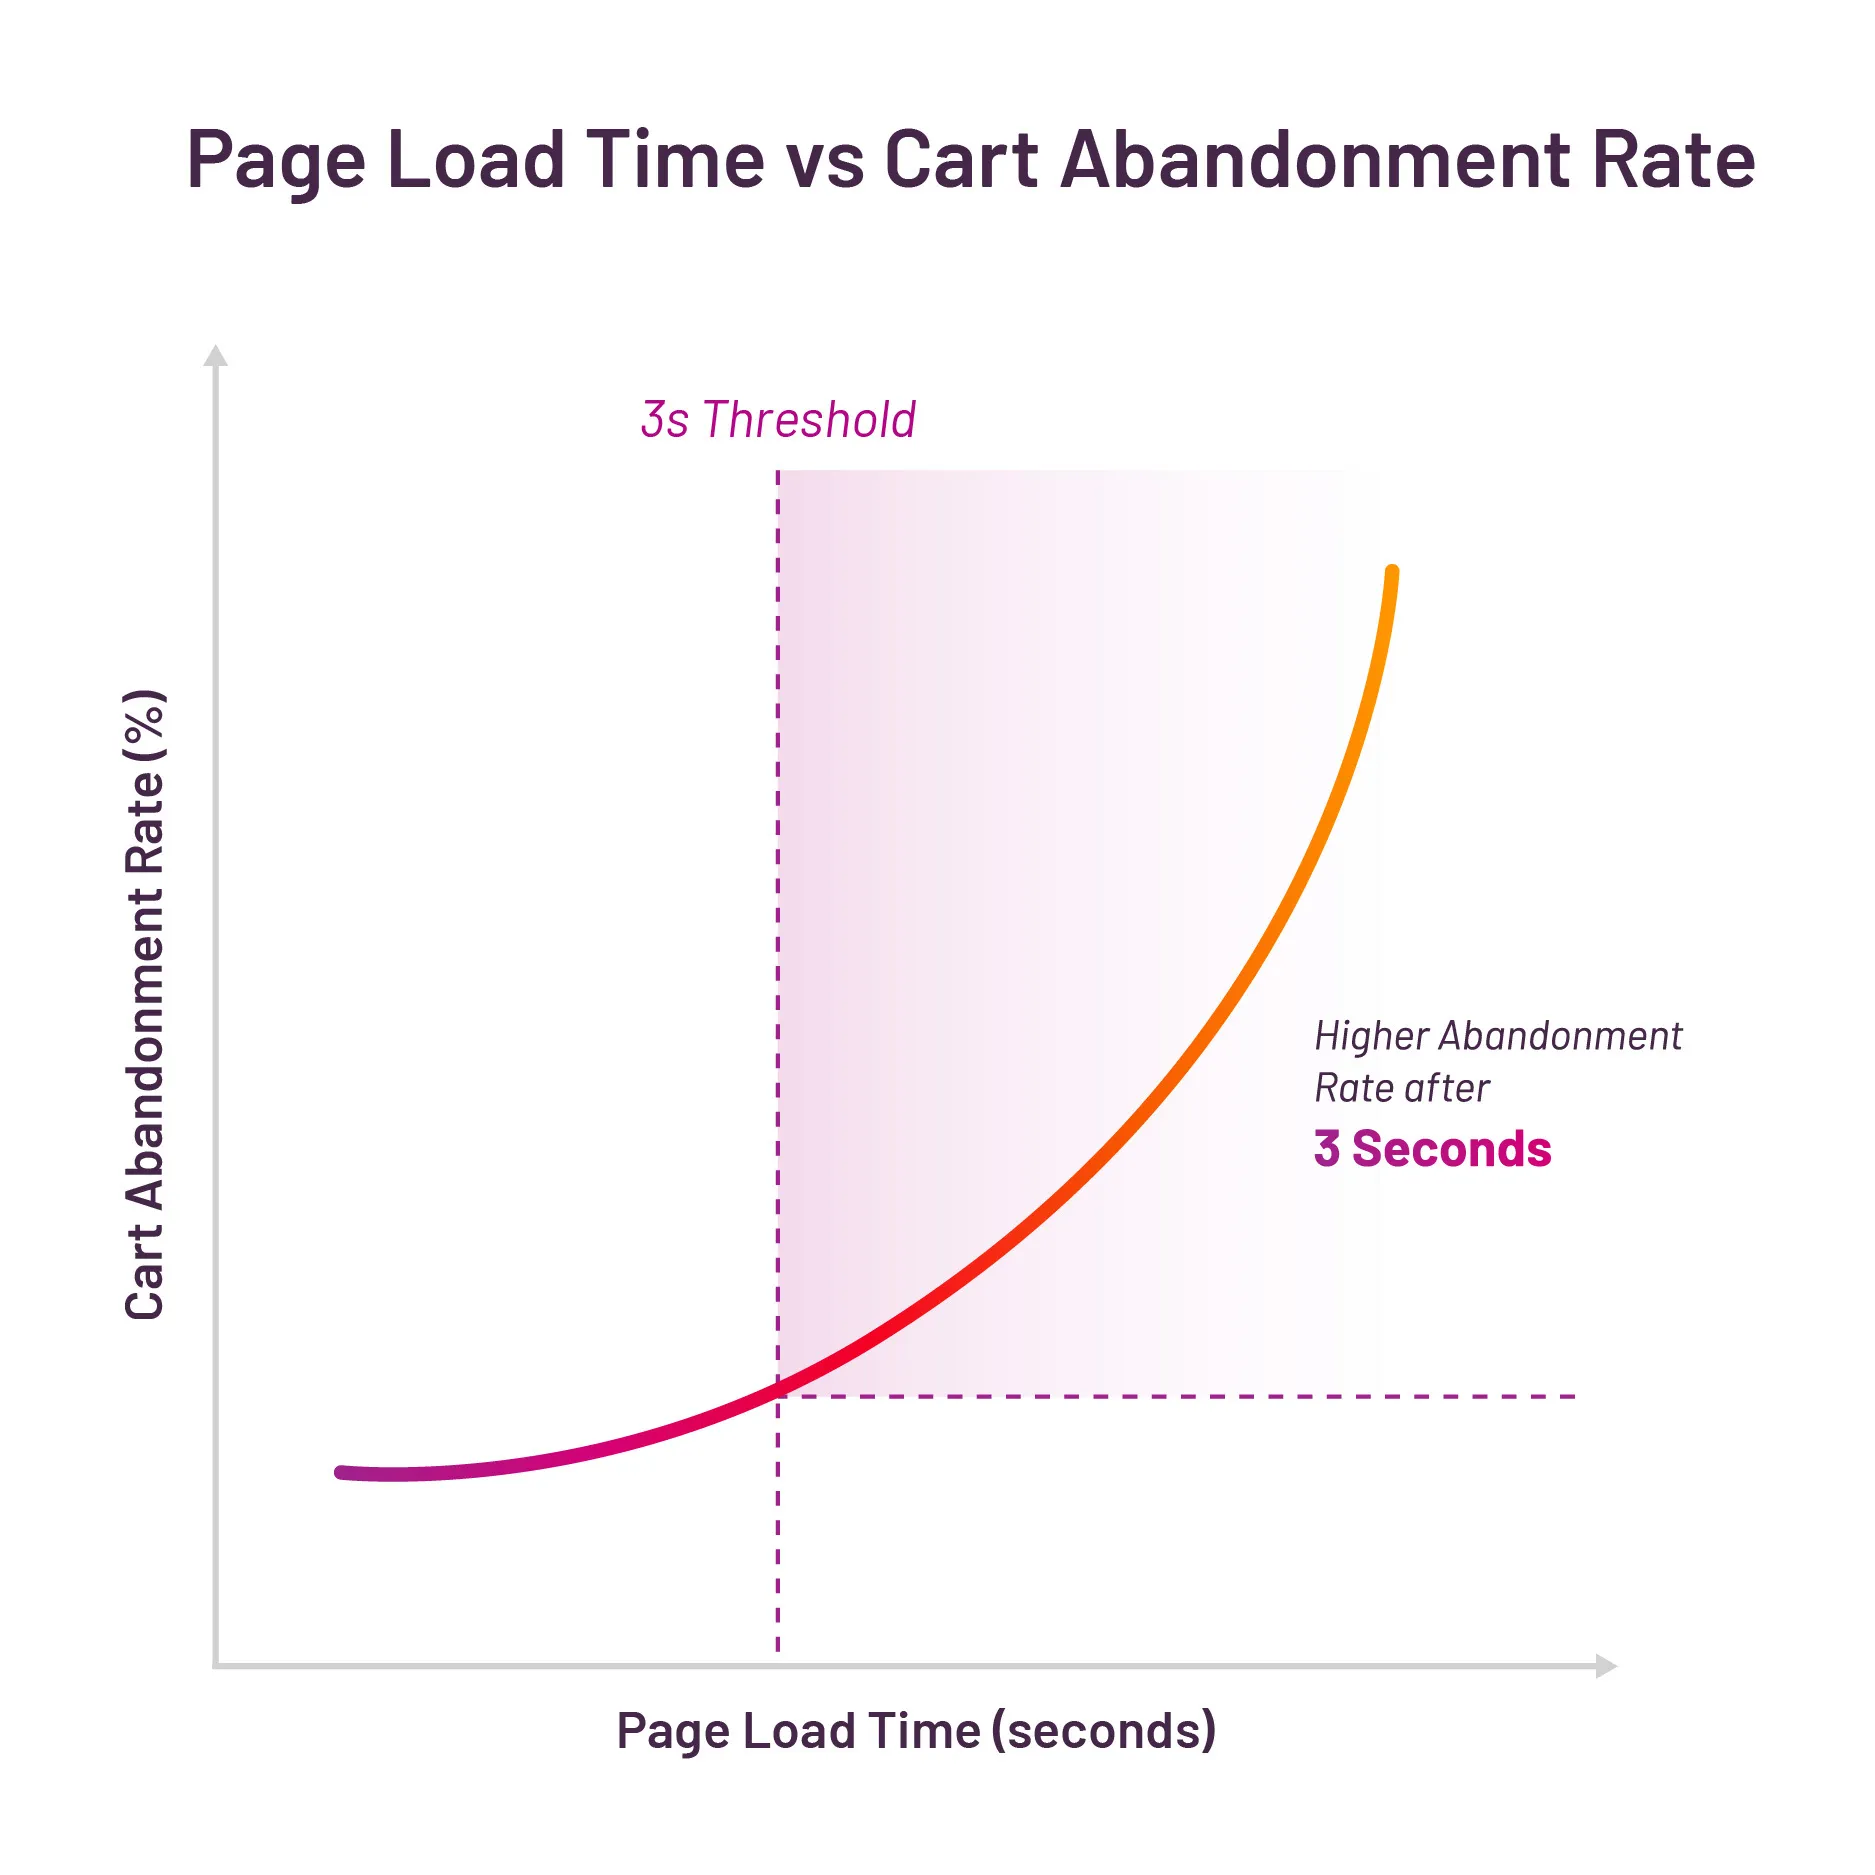
Fig 3: Combination of Digital Experience Monitoring and Business Observability
2. Journey-Centric Observability
Monitors end-to-end user flows and their business impact. Example: A telecom onboarding journey highlights drop-offs at “Plan Selection” due to UI or performance issues.
- Cause: Drop at a specific journey stage
- Effect: Issue in the journey leg (UX or performance)
- Business Impact: Reduced customer acquisition
Specific Approaches in BCO with DEM
1. Correlating System Performance with Business KPIs
A video streaming platform correlates latency and buffer time with churn or user retention.
2. User Journey Mapping and Heatmaps
Visualizing drop-offs helps pinpoint journey bottlenecks, like login → transaction in a banking app.
3. Deep Observability into the Stack
Combining network, infrastructure, and app performance creates true full-stack observability.
Conclusion
DEM empowers ITOM and BizOps teams with real-time visibility into user interactions, enabling faster diagnosis, improved user experience, and stronger business outcomes.
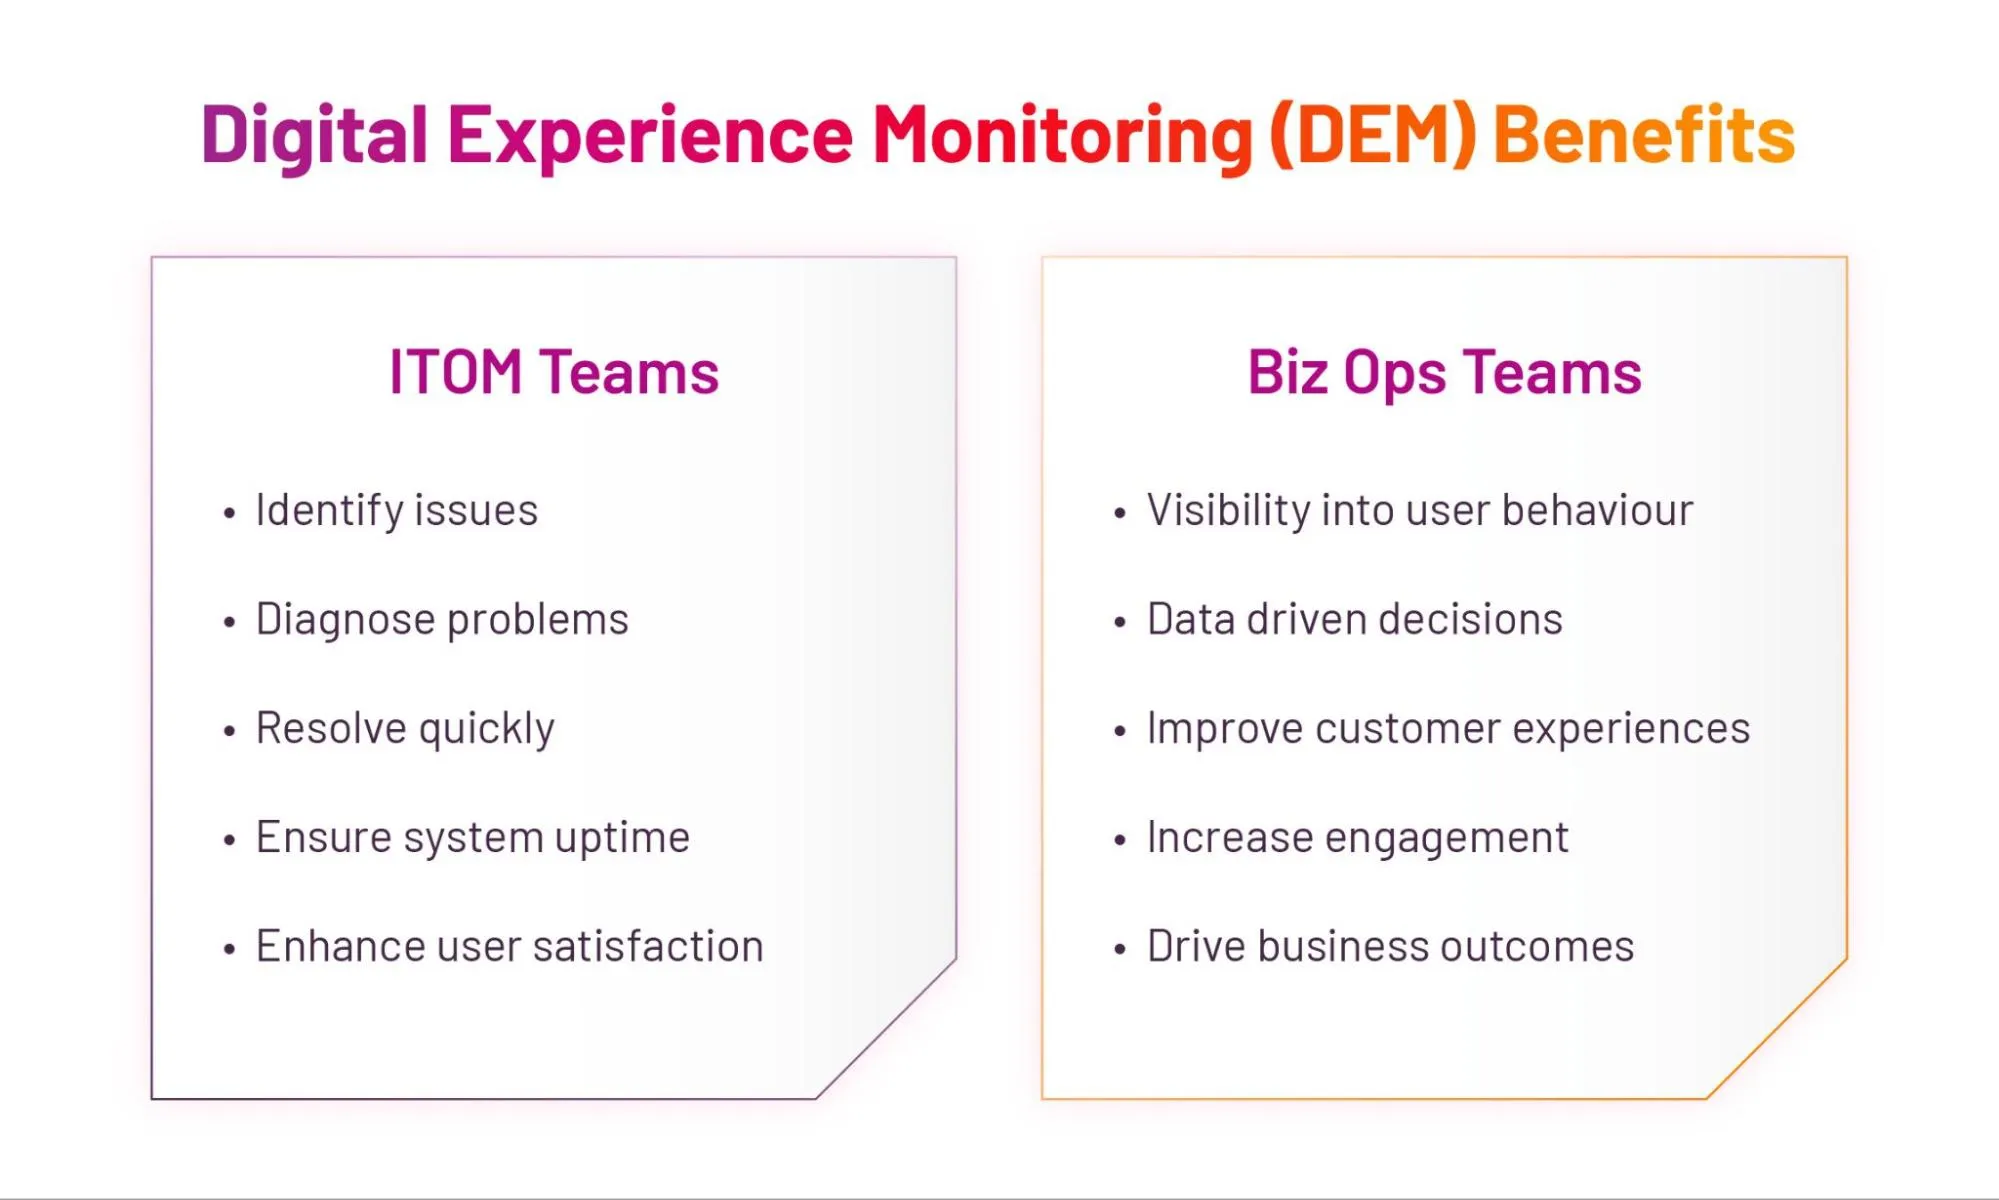
Fig 4: Digital Experience Monitoring (DEM) Benefits